Line Graphs
Line Graphs: Overview
This topic covers concepts, such as Structure of Line Graphs, Formation of Line Graphs from Bar Graphs, Formation of Data Table from Line Graph, Line Graphs with Uniform Intervals, Plotting Single Line in a Line Graph, Multiple Line Graph, etc.
Important Questions on Line Graphs
Read the following graph carefully and answer the questions given below. Number of players participating and winning medal in a national sport competition of a country (in ):
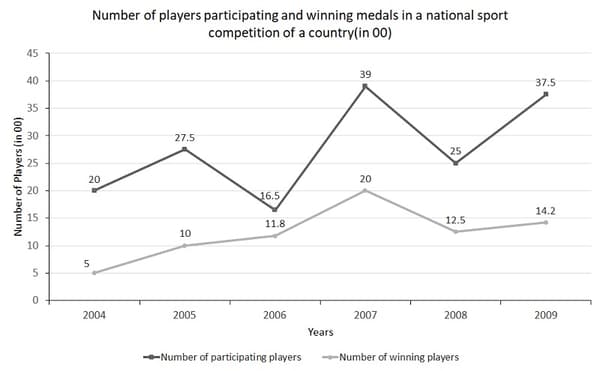
What is the percentage decrease in the number of players participating from to ?
Study the following graph carefully and answer the question given below:
The following line graph gives the number of Students Studying in Different Universities in a year,
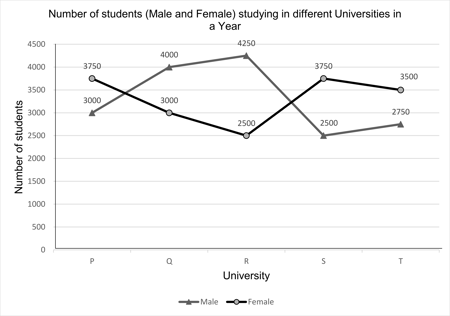
What is the average number of females in all the Universities together?
Study the following graph carefully to answer the question given below.
Number of selected employees in different grades/ranks by three companies in
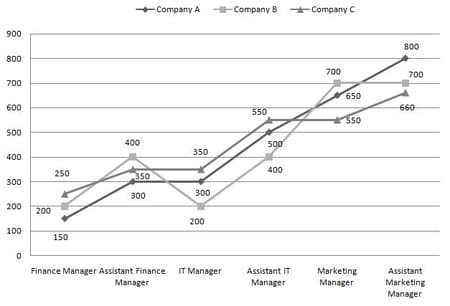
What is the respective ratio of selected employees for the post of assistant IT managers by all the companies A, B and C together ?
Study the following line graph and answer the questions based on it.
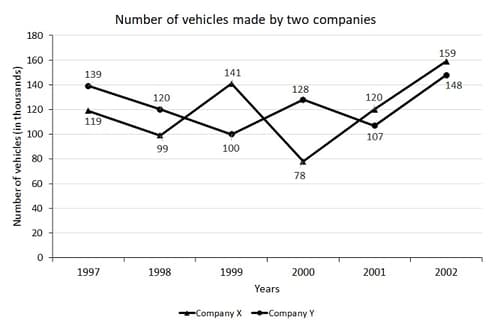
What is the difference between the numbers of vehicles manufactured by Company Y in and ?
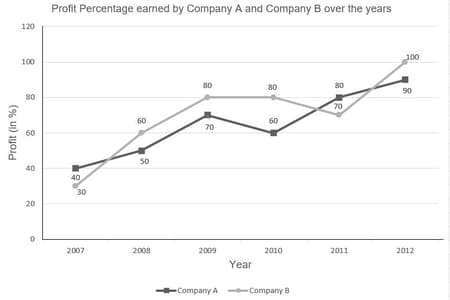
Study the following graph carefully and answer the questions given below:
The below line graph represents the profit (in ) earned by two companies over the years.
Answer the given question based on the following data:
The below graph represents the Export of Cashew nuts in Quantity and Values from the USA during .
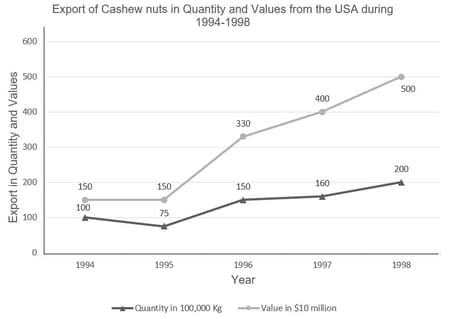
If the quantity of exports in was more than the average export for the given period, what was the volume exported in ?
Read the following graph carefully and answer the question given below-
Production of truck (in ) by two companies in different years
What is the respective ratio between the production of company A in and production of company B in
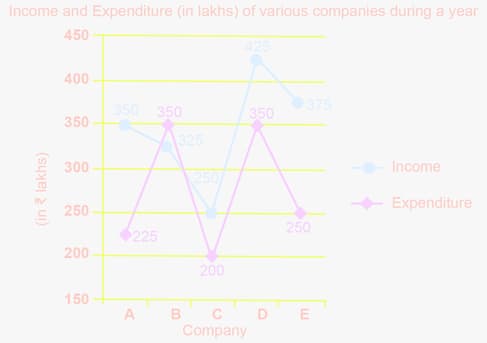
Study the following graph carefully and answer the question given below:
The below line graph shows the Income and Expenditure (in ) of various companies during a year,
Read the following graph and answer the questions given below-
The following graph shows the balance of three persons Uday, Vijay and Lokendra in a branch of IOB for theundefined of the year.
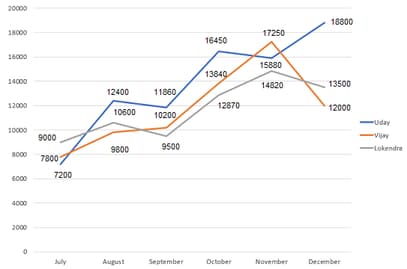
Balance of Lokendra in first three months is approximate what percent of the balance of last three months salary?
Read the following graph carefully and answer the questions given below. Percentage profit of two companies in different years:
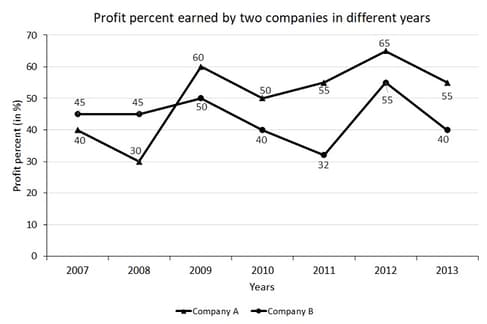
If total income of company B in was , then what was the total expenditure of that company in the same year?
Study the following information and answer the question that follows:
Number of Units Manufactured and Sold by Company Over the Years (Units in )
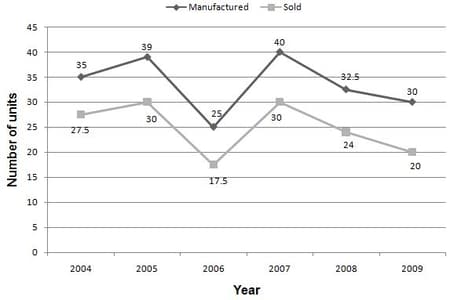
What is the difference between the number of unsold units of the company in the year and the number of unsold units of the company in the year
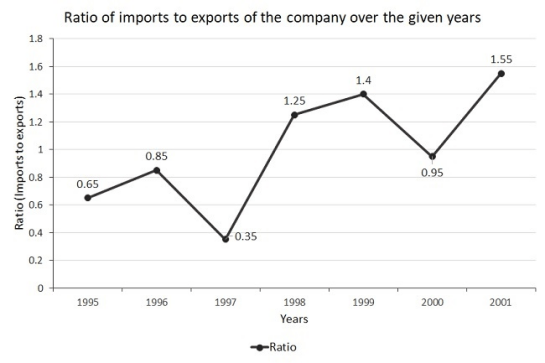
The following line chart gives the ratio of the amounts of imports by a company to the amount of exports from that company over the period from to . Answer the following questions based on following line graph:
In how many of the given years were the exports more than imports?
Read the following graph carefully and answer the question given below.
Production of wheat in different states in
What is the total production of wheat in all the states in (in )
Study the following graph and answer the questions given below:
The below line graph shows the number of Bike and type sold (in thousand) over the years.
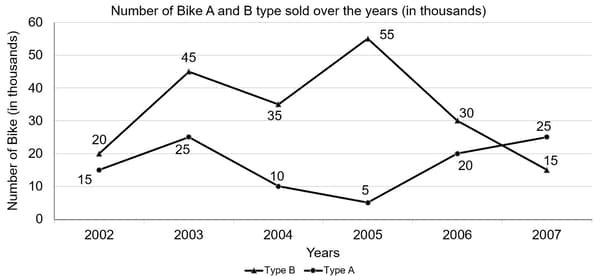
What is the average number of bikes of type for all the years together?
Study the given line graph carefully and answer the following questions. The graph shows the ratio of imports to exports of two companies and over the years.
The ratio of imports to exports of Company in the year was what more than that of Company in the year ?
The following line graph gives the ratio of the amounts of imports by a company to the amount of exports from that company over the period from to .
The ratio of Value of Imports to Exports by a Company over the Years.
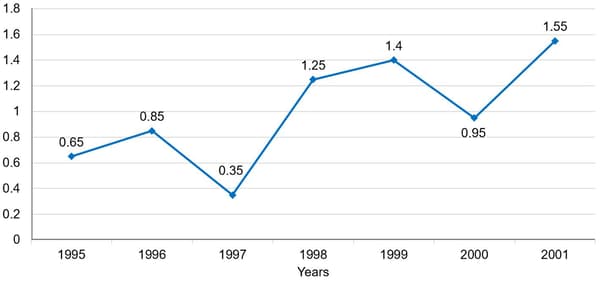
What was the percentage increase in imports from to ?
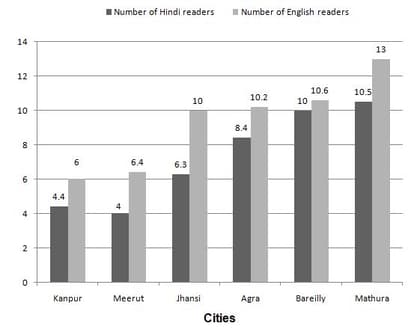
Read the following graph and table carefully and answer the question given below:
Number of Hindi and English newspaper readers (in thousands) in cities
The table of male and female ratio is as follows:
| Cities |
Hindi Male:Female |
English Male:Female |
| Kanpur | ||
| Meerut | ||
| Jhansi | ||
| Agra | ||
| Bareilly | ||
| Mathura |
What is the respective ratio of number of Hindi male reader in Bareilly and number of English male readers in the same city?
Study the following line graph and answer the following question below:
The following line graph shows the ratio of expenditure to income of three companies , and during the period .
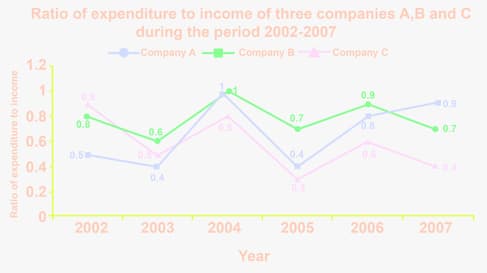
In which of the following years the percentage loss/profit of the Company is the maximum?
The following line graph gives the ratio of the amounts of imports by a company to the number of exports from that company from to .
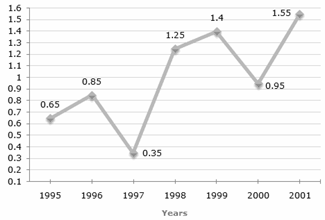
If the imports in the were ₹. and the total exports in the years and were ₹. , then the imports in were
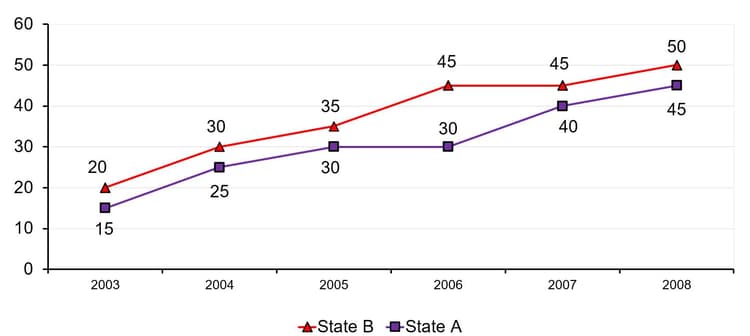
Study the following graph carefully to answer the question below:
The below graphs shows the information about the populations of two States (In millions) over the years,